Data visualization tools and data management: Capacity building
On 18 May 2017 at Potsdam, Germany, a dedicated meeting was held on the data visualization tools for Work Package 5 and a workshop was held on data management/analysis routines, shared libraries, common standards.
Data visualization tools for Work Package 5
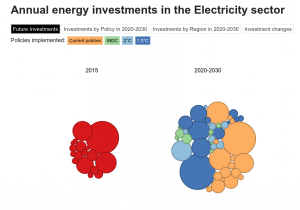
The data-visualization is a tool to explore the multiple dimensions of the dataset: policy, time and regional dimension. The webpage was coded in HTML/CSS and the data-visualization using d3.js. Data is embedded in a csv file. A demonstration was given of the progress made on the tool, as shown in the figure below, and a temporary website address was shared with the group so that the tool can be reviewed by all members of the CD-LINKS consortium.
During the meeting, presentations were given by:
- Valentina Bosetti: Brief introduction to the agenda, recap of WP 5 discussions during CD-LINKS workshop
- Elmar Kriegler: Overview of SENSES project, introduction of the term ‘Climate Change Scenario Services’
- Boris Müller (FH Potsdam): Examples of data visualization, applications in the context of climate change
- Daniel Huppmann: Overview of visualization hierarchy (infographics / scenario portal / scenario data explorer), presentation on new web database infrastructure at IIASA (ix Modeling Platform, ixmp)
It was agreed during the meeting that a common data repository (Integrated Assessment Modeling Consortium (IAMC) Annual Release, IAMC Scenario Portal) with regular updates might be a useful avenue to present the ‘state-of-the-art’ and provide an entry point to the most up-to-date results from the IAM community. As a result of this meeting, a draft proposal will be prepared and submitted to the IAMC Steering Committee for further discussion.
Workshop for data management/analysis routines, shared libraries and common standards
A workshop was also held on data management/analysis routines, shared libraries and common standards. A presentation was given by Jan Dietrich on the overview of data management standards of the different CD-LINKS teams.
An open discussion then took place, followed by an agreement to pursue the following action items:
- set up a Github repository under the IAMC umbrella for a data analysis package specifically aimed at the IAMC data template
+ function for generating standard figures as pdf (‘country profiles’) to be used as first consistency check for scenario results (before uploading to the IIASA database)
+ data sanity checking (based on error/warning messages during upload to the IIASA database)
+ own R class for IAMC-style timeseries objects (based on quitte or magclass)
+ future: direct upload from R to the IIASA database using R-ixmp API
The management of model input data, how to learn from each other and burden-sharing on reference data updates will need to be discussed in the future. It was also noted the need to specifically write work packages (and prepare a budget) for capacity building and shared data format/tool development in future proposals.


