
Tools
Atlas of Climate Policy Barriers
Atlas of Climate Policy Barriers
 The Atlas of Online Policy Barriers is an an online map tool that visualizes data representing key implementation barriers and challenges to climate policy. This data ranges from committed emissions to subsidies to fossil fuels and from clean energy investment gaps to emissions embedded in imported goods. The tool is aimed at communicating to a non-technical audience the major challendges, hot spots and criticalities for guiding climate and sustainable development related policy making.
Global Stocktake Indicator Tool
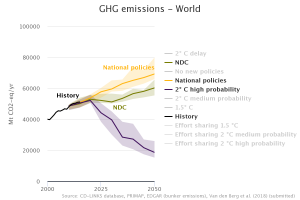
The global stocktake indicator tool measures progress towards Paris goals, but not only in terms of greenhouse gas emissions. It shows the implications of the implementation of national climate policies, and how they add up to the greenhouse gas emission reductions needed to keep global warming to well below 2˚C or even 1.5˚C. In addition, the tool shows whether current investments, decarbonisation rates, policy coverage and innovations are aligned with long-term goals.
CD-LINKS Scenario Explorer
Scenario Explorer
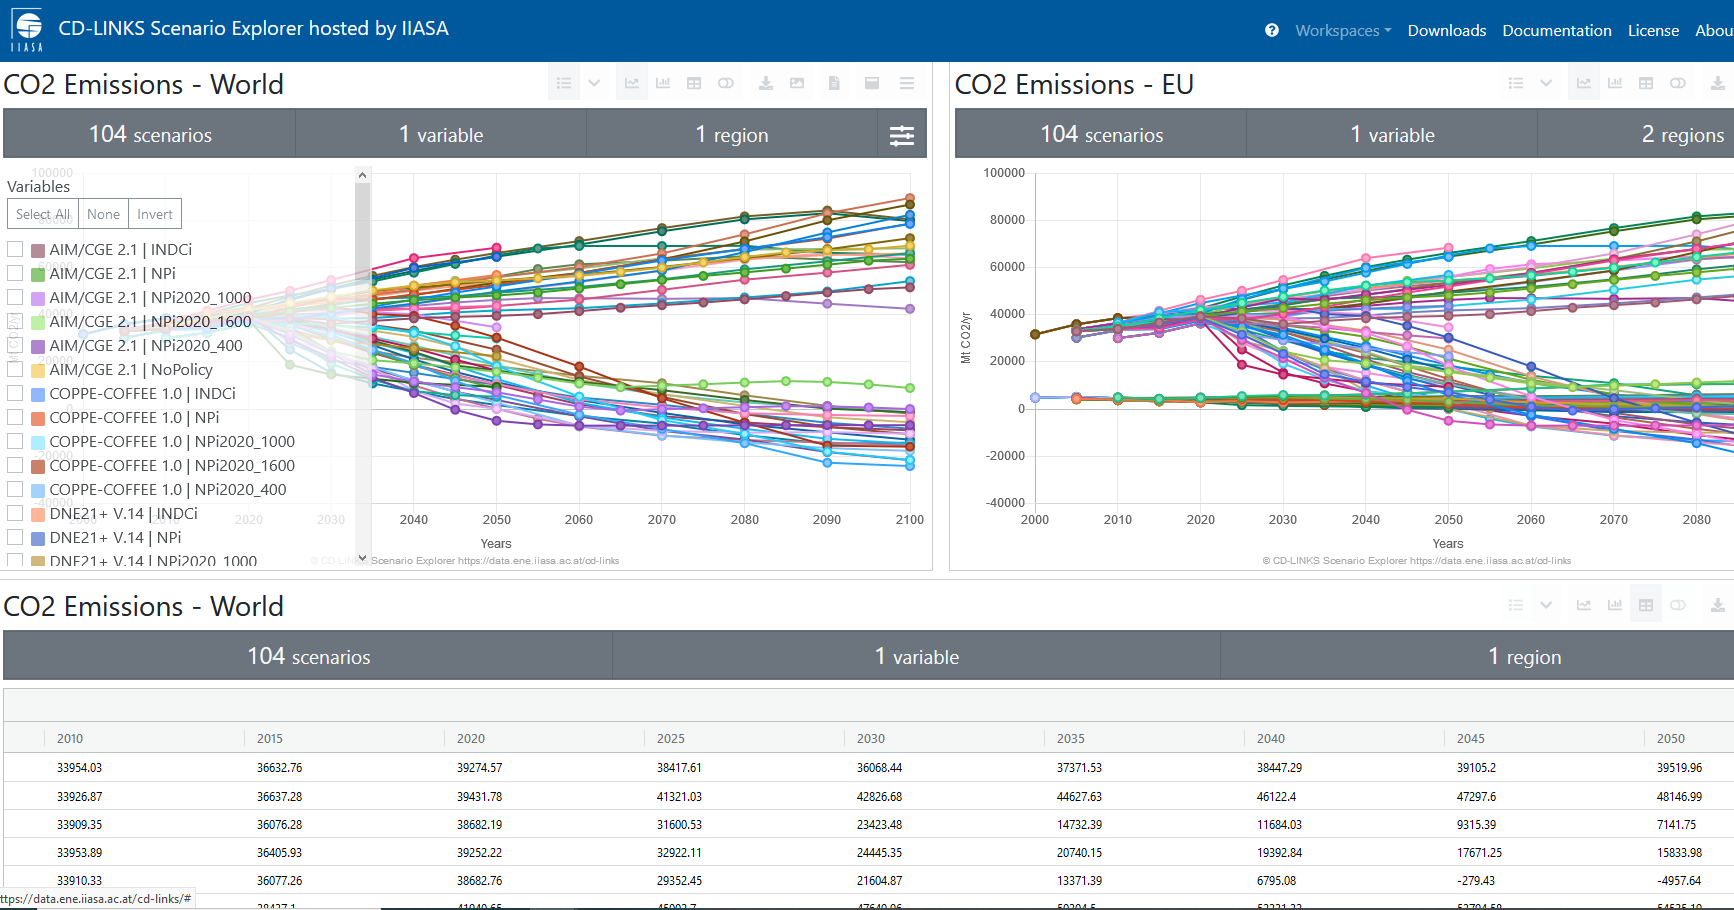
The CD-LINKS consortium has developed a set of consistent national and global low-carbon development pathways that take current national policies and the Nationally Determined Contributions (NDCs) as an entry point for short-term climate action and the transition to long-term goals of well-below 2°C and 2°C as defined by the Paris Agreement. These climate policy scenarios can also used as a basis to explore synergies and trade-offs between multiple sustainable development objectives and can be accessed through an interactive scenario explorer.
IAMC 1.5°C Scenario Explorer hosted by IIASA
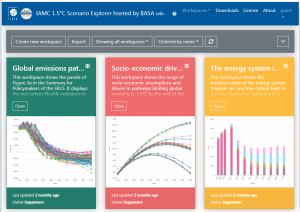
The CD-LINKS project contributed to the collection and vetting of the scenario ensemble that was assessed in the IPCC Special Report on Global Warming of 1.5°C (SR1.5). This quantitative, model-based scenario ensemble is accessible through the IAMC 1.5°C Scenario Explorer hosted by IIASA. The scenario ensemble contains more than 400 emissions pathways, which focus on limiting temperature rise to below 1.5°C or 2°C above pre-industrial levels, and provide information on the underlying socio-economic development, energy system transformations and land use change until the end of the century, developed by over a dozen research teams from around the world.
Climate Policy Database
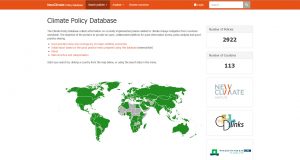
The Climate Policy Database collects information on currently implemented policies related to climate change mitigation from countries worldwide. The objective of the portal is to provide an open, collaborative platform for quick information access, policy analysis and good-practice sharing. It is maintained by NewClimate Institute in collaboration with PBL and Wageningen University.
Energy Investment Tool
CD-LINKS researchers have created an interactive visualization tool that illustrates the need to markedly scale up low carbon investments if the world is to achieve the Paris Agreement’s aim of keeping global warming well below 2°C or even 1.5°C. The study published in the journal
Nature Energy is based on scenario analysis from six different integrated assessment models that are part of CD-LINKS.
Country-level Social Cost of Carbon / Database Explorer
Country-level Social Cost of Carbon / Database Explorer
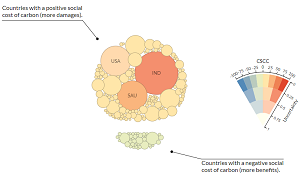 The Country-level Social Cost of Carbon Database Explorer presents the work of Ricke et al. (2018). It contains uncertainty bounds under all scenarios, model specifications and discounting schemes. Country-level population and GDP projections are issued from the Shared Socioeconomic Pathways (SSP) database. Gridded climate projections are based on the Representative Concentration Pathways (RCP) and were generated by climate models participating to CMIP5. By default, the SSP are projected along with the closest RCP in terms of radiative forcing.
pyam – Analysis and Visualization of Assessment Models
Documentation | Source code (github)
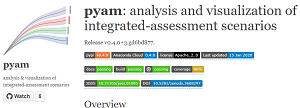 The open-source Python package pyam provides a range of diagnostic tools and functions for analyzing and visualizing data from integrated assessment models. The package has been used in the scenario analysis of the IPCC Special Report on 1.5°C (SR15) and the harmonisation of emission timeseries data in the Coupled Model Intercomparison Project (CMIP6). The features of pyam allow to easily perform and share such analysis for greater transparency and reproducibility, for example using Jupyter notebooks.The package has been designed according to best practices of scientific software development, including automatic documentation, unit testing, and continuous integration.
Scientific reference: Matthew J. Gidden and Daniel Huppmann, pyam: a Python Package for the Analysis and Visualization of Assessment Models,The Journal of Open-Source Software, in review.